
Want to share your content on R-bloggers? click here if you have a blog, or here if you don’t.
Reposted from the original at https://blog.stephenturner.us/p/r-450-bioconductor-321.
Faster package installation, import only the functions you want with use(), built-in Palmer penguins data, grep values shortcut, and lots of new bioinformatics packages in Bioconductor
R 4.5.0 was released last week, and Bioconductor 3.21 came a few days later. You can read the R release notes here and the Bioconductor 3.21 announcement here. Here I’ll highlight a few things that are worth upgrading for.
R 4.5.0
You can read the R release notes here or just use news().
Faster install.packages()
Any time the minor version changes (e.g., 4.4.x to 4.5.x) you’ll need to reinstall all your packages again. Which will now be much faster thanks to under-the-hood changes to install.packages() that downloads packages in parallel:
install.packages()anddownload.packages()download packages simultaneously usinglibcurl, significantly reducing download times when installing or downloading multiple packages.
I don’t have any benchmarks to show but I can tell you reinstalling all my go-to packages was much faster than with previous upgrades and reinstalls.
I keep my own “verse” package on GitHub: github.com/stephenturner/Tverse. This “package” is just an empty package with a DESCRIPTION listing all the packages I use most frequently as dependencies (tidyverse, janitor, pkgdown, usethis, breakerofchains, knitr, here, etc). I’ll first install.packages("devtools"), then devtools::install_github("stephenturner/Tverse"), and all the packages I use most frequently are installed because this dummy “verse” package depends on them. You never want to load this library, but it’s an easy way to reinstall all the R package you use frequently on any new machine or with an R upgrade.
Built-in penguins data
The built-in iris dataset leaves something to be desired. It’s overused and not very engaging for learners or audiences who’ve seen it repeatedly. It’s small (150 rows), clean (no missing data), and doesn’t present challenges to deal with like outliers and multiple categorical labels. And, if you look at the help for ?iris, you’ll see it was published by Ronald Fisher in the Annals of Eugenics, not something I’d care to cite.
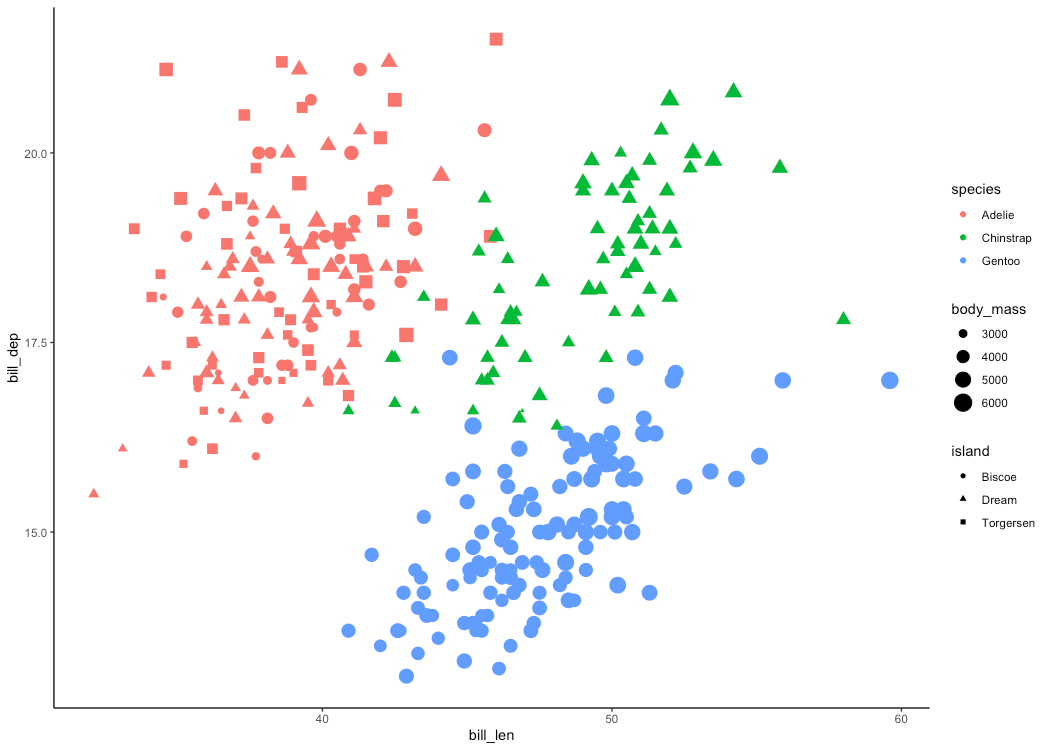
Back in 2020, Allison Horst published the palmerpenguins package — a data package meant to provide a great dataset for data exploration and visualization as an alternative to iris. Previously you had to install the package to use the data, but now the penguins data is built in, as is the less clean penguins_raw data that can be used for teaching data cleaning and manipulation.
library(ggplot2)
ggplot(penguins, aes(bill_len, bill_dep)) +
  geom_point(aes(col=species, size=body_mass, shape=island)) +
  theme_classic()
And if you’ve written tutorials using the palmerpenguins package, know that the column names differ between the palmerpenguins and base R versions. You might check out the new basepenguins package (documentation). This package gives you functions to convert all your code over to use the base version.
Import only what you want with use()
If you’re coming from Python you’re used to being able to only import what you need from installed packages. E.g.:
from numpy import array, mean
from pathlib import Path
With R if you want to call a function from a package without loading the entire namespace you can always use the double-colon, e.g. dplyr::select(). With R 4.5.0 you can import only the functions you want from any particular package.
use("dplyr", c("filter", "count"))
penguins |>
  filter(island=="Torgersen" & year==2007) |>
  count(sex)
     sex n
1 female 8
2   male 7
3   <NA> 5
There’s a gotcha here though. As the documentation states, use() is a simple wrapper around library which always uses attach.required=FALSE. That means once you call use() the first time, you need to import all of the functions that you might want to import. If you call use() again or even library(), you still won’t have access to those other functions.
In reality I think I’ll still use the package::function() syntax when I don’t want to load the full library, but it’s nice to have this option. See also the box and conflicted packages.
## This works
use("dplyr", c("filter", "count"))
penguins |>
  filter(island=="Torgersen" & year==2007) |>
  count(sex)

## This fails!
library(dplyr)
penguins |>
  mutate(ratio=bill_len/bill_dep)
Error in mutate(penguins, ratio = bill_len/bill_dep) :
  could not find function "mutate"
grepv(): shortcut for grep(..., value=TRUE)
A very small quality of life improvement. If you use grep(), you get the indices of the vector that match your pattern. To get the actual matched values, you can add value=TRUE, or just use the new grepv() function instead.
x <- c("apple", "banana", "whatsapp")

grep("app", x)
#> [1] 1 3

grepv("app", x)
#> [1] "apple"    "whatsapp"
Bioconductor 3.21
You can read the full Bioconductor 3.21 announcement here. You can install it with:
if (!require("BiocManager", quietly = TRUE))
    install.packages("BiocManager")
BiocManager::install(version = "3.21")
There are 72 new software packages in this release of Bioconductor, bringing the total 2341 software packages, 432 experiment data packages, 928 annotation packages, 30 workflows and 5 books. This release introduces a wide array of new tools and packages across genomics, transcriptomics, proteomics, metabolomics, and spatial omics analysis. Notable additions include new frameworks for spatial transcriptomics (like clustSIGNAL, SEraster, and CARDspa), enhanced utilities for analyzing single-cell data (SplineDV, mist, dandelionR), and cutting-edge methods for integrating and visualizing multi-omics datasets (RFLOMICS, pathMED, MetaboDynamics). The release also features robust statistical and machine learning approaches, such as LimROTS, CPSM, and XAItest, for improved inference and predictive modeling. Several tools improve visualization, accessibility, and reproducibility, including GUI-based apps (geyser, miaDash, shinyDSP) and packages focused on optimizing performance or interoperability (e.g., RbowtieCuda, ReducedExperiment, Rigraphlib).
You may also want to skim through the release notes to look through the updates to existing packages you already use.
R-bloggers.com offers daily e-mail updates about R news and tutorials about learning R and many other topics. Click here if you’re looking to post or find an R/data-science job.
Want to share your content on R-bloggers? click here if you have a blog, or here if you don’t.
Continue reading: Repost: R 4.5.0 and Bioconductor 3.21
Long-term Implications and Future Developments for R 4.5.0 and Bioconductor 3.21
The release of R 4.5.0 and Bioconductor 3.21 have significant long-term implications for the field of data science, particularly in the realm of bioinformatics. This article will explore the merits of these updates and discuss potential future developments.
Faster Package Installation
R 4.5.0 boasts significantly enhanced package installation speeds. The minor version change has initiated technical alterations that enable install.packages() to download packages in parallel. Users can expect much faster download times when installing or downloading multiple packages, thereby streamlining project setup.
Actionable advice: Maintaining a ‘verse’ package that lists frequently used packages as dependencies is an efficient way to reinstall all necessary packages on a new machine or following an R upgrade. Maintain and update your ‘verse’ package to continually streamline your workflow.
Useful Data for Learning
The addition of the built-in penguins data to R 4.5.0 provides more engaging and diverse data for learners. Unlike the iris dataset, which is overused and lacks challenges like outliers and multiple categorical labels, the penguins dataset offers a more realistic basis for data exploration and visualization training.
Actionable advice: For those writing tutorials, familiarize yourself with the built-in penguins data and consider using it to offer a more stimulating learning environment.
Import Only the Functions You Want with use()
The use() function in R 4.5.0 allows users to import only the functions they need from installed packages. However, once you use the function, you will need to import all the functions you might want to import as trying to import other functions later will not be possible.
Actionable advice: Learn and implement the use of use() judiciously to optimize your workspace.
New Package: Bioconductor 3.21
Bioconductor 3.21 offers 72 new software packages, enhancing the analytical capabilities of genomics, transcriptomics, proteomics, metabolomics, and spatial omics. Tools for spatial transcriptomics, single-cell data analysis, multi-omics datasets integration, robust statistical and machine learning approaches, and improved visualization are some of the impactful offerings.
Actionable advice: Regularly update your version of Bioconductor and familiarize yourself with the latest packages. Bioconductor 3.21’s considerable additions could greatly enhance your data analysis capabilities.
Conclusion
The upgraded releases of R and Bioconductor are steps towards improving productivity, expanding analytical capacities, and enriching the learning process. By integrating the newly added functionalities into their workflows, data scientists and learners can progressively elevate their skills and outcomes. Keeping abreast of these enhancements and understanding how to utilize them will likely be integral to success in future data analysis endeavors.