by jsendak | Apr 15, 2025 | DS Articles
Exploratory Data Analysis (EDA) is an important step when working with any dataset. Let’s explore some useful Pandas one-liners that can help you quickly understand your data.
Understanding the Importance of Exploratory Data Analysis (EDA) and Pandas One-Liners
In the era of big data and machine learning, data analysis emerges as one of the critical steps before jumping onto creating models. Especially, Exploratory Data Analysis (EDA) plays a vital part in understanding your data better. EDA is used to summarize main characteristics of data, visualize them, and formulate hypotheses that could lead to new data collection and experiments. In this context, Pandas, a flexible and efficient Python library for data manipulation, can come in handy with a variety of one-liners used for data analysis.
The Long-term Implications and Possible Future Developments
Exploratory Data Analysis (EDA) and Pandas are likely to gain more traction with the growth in big data and machine learning. As more organizations become data-driven, the need for DA tools to analyze and extract meaningful insights will continue to grow.
“EDA and Pandas can be the difference in gaining accurate insights or missing vital information hidden in your data.”
Moreover, the rise of machine learning applications will further necessitate the need for data preprocessing and analysis as it forms the foundation of any machine learning model. Therefore, the importance of mastering EDA and Pandas one-liners is bound to increase in the future.
Actionable Advice
- Invest Time in Mastering EDA: The entire process of data analysis becomes streamlined when you are adept at exploring data in its raw form. Explore and understand concepts like data distributions, outliers, correlations, etc. This will not only help you understand the data at a much deeper level but also let you come up with more accurate models in the future.
- Understand and Use Pandas One-liners: Pandas one-liners can save you a significant amount of time when dealing with data analysis. Familiarize yourself with functions and their implementations. Become proficient in Pandas operations like handling null values, slicing, reshaping data, etc. This will help you immensely in handling data of all forms and sizes.
- Stay Updated and Practice: With constant advancements, it’s important to stay updated with new features and functionalities in both EDA techniques and Pandas. Regularly practicing data analysis can also help you stay abreast of the changes and understand how to best leverage these tools.
In sum, EDA and Pandas can provide you with the necessary tools to unlock valuable insights from your data. Investing time in mastering these can go a long way in your data analysis journey.
Read the original article
by jsendak | Apr 15, 2025 | DS Articles

Blog
Analysis and Long-Term Implications
In this deep dive, we assess the potential long-term implications and future development prospects outlined in the text. Understanding these is crucial as they can have far-reaching implications on crucial decision-making aspects of several industries.
Long-Term Implications
The text primarily indicates that there could be a significant shift in industry dynamics in the near future. The long-term implications of this change could be manifold and have considerable impacts on the affected sectors’ business growth strategies, investment needs, and operational structures.
Industries need to adapt to such changes by incorporating an effective strategy that consistently aligns them with the prevailing and predicted future trends.
If industries fail to accurately identify these trends and adapt in a timely and effective manner, this could potentially jeopardize their growth and sustainability in an evolving business environment.
Possible Future Developments
The text suggests a number of possible future developments. These primarily revolve around industry transformations and evolving business strategies. As these changes take place, they are likely to create new opportunities as well as challenges for companies.
Businesses should follow the changing trend by enhancing their flexibility and adaptability. Continuous process innovation, diversification, and digital transformation could also form part of their strategic roadmaps for the future.
Through these approaches, companies can not only sustain but even enhance their market presence and competitive edge in the evolving business environment.
Actionable Advice
Based on the above analyses, the following are some pieces of advice that can be adopted:
- Continuous Learning: Industries must adapt to a culture of continuous learning to keep up with the emerging trends and their potential impacts.
- Flexible Strategies: Companies should develop flexible business strategies that enable them to quickly adjust their course in response to any future industry changes.
- Investment in Technology: Industries should make strategic investments in technology to boost their adaptability to future developments. For instance, advanced data analytics can provide them with valuable insights into current trends and future predictions,
- Diversification: Businesses should also consider diversifying their offerings to mitigate potential risks associated with future uncertainties.
Reflecting upon these, businesses can position themselves to not just survive but prosper in the ever-evolving market landscape.
Read the original article
by jsendak | Apr 14, 2025 | DS Articles
In Epiverse-TRACE we develop a suite of R packages that tackle predictable tasks in infectious disease outbreak response. One of the guiding software design principles we have worked towards is interoperability of tooling, both between Epiverse software, but also integrating with the wider ecosystem of R packages in epidemiology.
This principle stems from the needs of those responding to, quantifying, and understanding outbreaks, to create epidemiological pipelines. These pipelines combine a series of tasks, where the output of one task is input into the next, forming an analysis chain (directed acyclic graph of computational tasks). By building interoperability into our R packages we try to reduce the friction of connecting different blocks in the pipeline. The three interoperability principles in our strategy are: 1) consistency, 2) composability, and 3) modularity.
To ensure interoperability between Epiverse-TRACE R packages is developed and maintained, we utilise integration testing. This post explains our use of integration testing with a case study looking at the complementary design and interoperability of the {simulist} and {cleanepi} R packages.
In comparison to commonly used unit testing, which looks to isolate and test specific parts of a software package, e.g. a function; integration testing is the testing of several components of software, both within and between packages. Therefore, integration testing can be used to ensure interoperability is maintained while one or multiple components in pipelines are being developed. Continuous integration provides a way to run these tests before merging, releasing, or deploying code.
How we setup integration testing in Epiverse
The Epiverse-TRACE collection of packages has a meta-package, {epiverse}, analogous to the tidyverse meta-package (loaded with library(tidyverse)). By default, {epiverse} has dependencies on all released and stable Epiverse-TRACE packages, therefore it is a good home for integration testing. This avoids burdening individual Epiverse packages with taking on potentially extra dependencies purely to test interoperability.
Just as with unit testing within the individual Epiverse packages, we use the {testthat} framework for integration testing (although integration testing can be achieved using other testing frameworks).
Case study of interoperable functionality using {simulist} and {cleanepi}
The aim of {simulist} is to simulate outbreak data, such as line lists or contact tracing data. By default it generates complete and accurate data, but can also augment this data to emulate empirical data via post-processing functionality. One such post-processing function is simulist::messy_linelist(), which introduces a range of irregularities, missingness, and type coercions to simulated line list data. Complementary to this, the {cleanepi} package has a set of cleaning functions that standardised tabular epidemiological data, recording the set of cleaning operations run by compiling a report and appending it to the cleaned data.
Example of an integration test
The integration tests can be thought of as compound unit tests. Line list data is generated using simulist::sim_linelist(). In each testing block, a messy copy of the line list is made using simulist::messy_linelist() with arguments set to specifically target particular aspects of messyness; then a cleaning operation from {cleanepi} is applied targeting the messy element of the data; lastly, the cleaned line list is compared to the original complete and accurate simulated data. In other words, is the ideal data perfectly recovered when messied and cleaned?
An example of an integration test is shown below:
set.seed(1)
ll <- simulist::sim_linelist()

test_that("convert_to_numeric corrects prop_int_as_word", {
  # create messy data with 50% of integers converted to words
  messy_ll <- simulist::messy_linelist(
    linelist = ll,
    prop_missing = 0,
    prop_spelling_mistakes = 0,
    inconsistent_sex = FALSE,
    numeric_as_char = FALSE,
    date_as_char = FALSE,
    prop_int_as_word = 0.5,
    prop_duplicate_row = 0
  )

  # convert columns with numbers as words into numbers as numeric
  clean_ll <- cleanepi::convert_to_numeric(
    data = messy_ll,
    target_columns = c("id", "age")
  )

  # the below is not TRUE because
  # 1. `clean_ll` has an attribute used to store the report from the performed
  # cleaning operation
  # 2. the converted "id" and "age" columns are numeric not integer
  expect_false(identical(ll, clean_ll))

  # check whether report is created as expected
  report <- attr(clean_ll, "report")
  expect_identical(names(report), "converted_into_numeric")
  expect_identical(report$converted_into_numeric, "id, age")

  # convert the 2 converted numeric columns into integer
  clean_ll[, c("id", "age")] <- apply(
    clean_ll[, c("id", "age")],
    MARGIN = 2,
    FUN = as.integer
  )

  # remove report to check identical line list <data.frame>
  attr(clean_ll, "report") <- NULL

  expect_identical(ll, clean_ll)
})
Conclusion
When developing multiple software tools that are explicitly designed to work together it is critical that they are routinely tested to ensure interoperability is maximised and maintained. These tests can be implementations of a data standard, or in the case of Epiverse-TRACE a more informal set of design principles. We have showcased integration testing with the compatibility of the {simulist} and {cleanepi} R packages, but there are other integration tests available in the {epiverse} meta-package. We hope that by regularly running these expectations of functioning pipelines, includes those as simple as two steps, like the case study show in this post, that maintainers and contributors will be aware of any interoperability breakages.
If you’ve worked on a suite of tools, R packages or otherwise, and have found useful methods or frameworks for integration tests please share in the comments.
Acknowledgements
Thanks to Karim Mané, Hugo Gruson and Chris Hartgerink for helpful feedback when drafting this post.
Citation
BibTeX citation:
@online{w._lambert2025,
  author = {W. Lambert, Joshua},
  title = {Integration Testing in {Epiverse-TRACE}},
  date = {2025-04-14},
  url = {https://epiverse-trace.github.io/posts/integration-testing/},
  langid = {en}
}
For attribution, please cite this work as:
W. Lambert, Joshua. 2025.
“Integration Testing in
Epiverse-TRACE.” April 14, 2025.
https://epiverse-trace.github.io/posts/integration-testing/.
Continue reading: Integration testing in Epiverse-TRACE
Integration Testing of Epiverse-TRACE Tools Holds Promising Future for Infectious Disease Outbreak Analytics
In an increasingly digitized world, the application of integrated software tools in epidemiology is transforming the way in which disease outbreaks are monitored and responded to. The developers at Epiverse-TRACE are constantly creating R packages that address predictable tasks in infectious disease outbreak response, with the crucial aim to offer a coherent and interoperable ecosystem.
Interoperability and its Long-Term Implications
Interoperability refers to the software design principle that allows mutual usage of packages. By creating epidemiological pipelines, a series of tasks can be combined where the output of one task becomes the input of the next, creating an efficiency-boosting analysis chain. Such an approach can contribute extensively to bolstering outbreak response systems.
The three pillars of this interoperable strategy include:
- Consistency: Ensuring uniformity in the functions of the packages
- Composability: Encouraging the combination and reuse of software components
- Modularity: Offering standalone functionalities that can be integrated as needed
The principle of interoperability can potentially revolutionize the way outbreak analytics are conducted and responded to. This could lead to improved prediction accuracy, more efficient workflows, and faster response times to emerging outbreaks. From a larger perspective, this could contribute to better public health outcomes and potentially save countless lives in the long run.
Integration Testing – A Pillar of Interoperability
Integration testing is a method where multiple components within and between software packages are tested for their ability to work cohesively. It is a fundamental element in ensuring the maintenance of the interoperability as components in pipelines develop and evolve over time. An example of this is the working of the {simulist} and {cleanepi} R packages developed by Epiverse-TRACE that can simulate and clean up outbreak data for analysis.
Future Developments
As these software tools continue to advance, one promising area of future development can be to expand interoperability across broader ranges of R packages in epidemiology, creating a more interconnected ecosystem of tools that can further streamline outbreak analytics. This could potentially involve the integration of data analysis, visualization, and reporting tools into the pipeline.
Actionable Advice
- Invest in Iterative Testing: Continuous, routine testing of interoperability can help software designers to catch and correct potential conflicts among different software packages.
- Embrace Transparency: Open-sourcing code can instigate more extensive testing and improvement suggestions from other developers, thereby increasing software performance and reliability.
- Adopt Modularity: Building software in modular units allows for more flexibility, wherein components can be alternately used or upgraded without having to overhaul an entire system.
- Promote Interoperability: Emphasizing interoperability in design principles can create more cohesive, flexible software environments and foster the development of comprehensive analytical pipelines in epidemiology.
Conclusion
The integration testing of interoperable R packages built by Epiverse-TRACE emerges as a pivotal strategy in optimizing tools for outbreak analytics. The future of infectious disease outbreak response stands to be significantly enhanced with the strengthening of interlinked software tools, ultimately contributing to more efficient, accurate, and timely responses to safeguard public health.
Acknowledgements
Special thanks for drafting the integration testing post to W. Lambert, Joshua, Karim Mané, Hugo Gruson and Chris Hartgerink. It was a valuable source of inspiration and guidance for this comprehensive follow-up.
Read the original article
by jsendak | Apr 14, 2025 | DS Articles
Effective data cleaning ensures accurate analysis. Discover Python tips to handle missing values, outliers, and inconsistencies with ease.
Effective Data Cleaning for Accurate Analysis
Data cleaning is a pivotal step in data preparation, analysis, and decision-making processes. With the increasing amount of data generated in the current era, the chances of encountering missing values, outliers and inconsistencies are higher than ever before. However, with the help of Python, a popular scripting language, managing these issues has become simpler and less time consuming.
Long-Term Implications and Future Developments
Ensuring consistent data cleaning practices with Python can undoubtedly alter the future landscape of data analysis and interpretation. This influence stems largely from the role data cleanliness plays in the accuracy of statistical models, predictive algorithms, and ultimately, business decisions.
Implications
- Informed Decision Making: Properly cleaned data can generate insights and models that significantly impact decision-making processes in businesses, government bodies, and non-profit organizations. This will likely increase reliance on data specialists capable of handling complex data cleaning tasks.
- Increased Accuracy of Predictive Models: Unclean data can lead to inaccurate predictive models that sometimes lead businesses down the wrong path. By ensuring clean data, businesses can improve the accuracy of their predictions, leading to more successful outcomes.
Future Developments
- Automated Data Cleaning: With advancements in AI and machine learning, we are likely to see more automated data cleaning solutions in the future. These applications will reduce the risk of human error and improve the speed of data preprocessing.
- Python’s Popularity: Python’s popularity is expected to continue to grow, and as it does, so too will its libraries and resources, making it even more useful for tasks such as data cleaning.
Actionable Advice
Given the longer-term implications and possible future developments in the field of data cleaning, the following steps are recommended:
- Invest in Python Training: Users can leverage the power of Python for data cleaning operations. Python libraries such as Pandas and Numpy offer a wide range of tools that make it easier to handle missing values, outliers, and inconsistencies.
- Focus on Data Quality: Data quality should be an organizational priority. The organization should invest in data quality tools and strategies to ensure that the data used for decision making is accurate, reliable, and consistent.
- Stay Updated: As the world of data and Python evolves, it’s vital to stay up-to-date with recent changes and trends.
Read the original article
by jsendak | Apr 14, 2025 | DS Articles
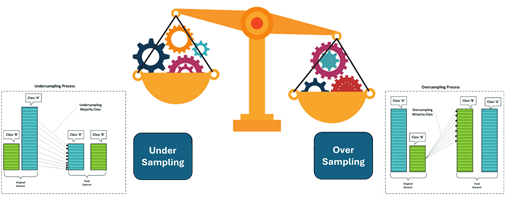
Introduction This article will address this issue using resampling techniques such as over-sampling and under-sampling, which help balance datasets and improve model performance. This core technique for balancing imbalanced datasets in machine learning uses over-sampling and under-sampling in machine learning for the datasets where one class significantly outweighs others. This imbalance can lead to biased… Read More »Exploring oversampling and under-sampling: Core techniques for balancing imbalanced datasets in ML
Analysis and Future implications of Resampling Techniques in Machine Learning
The text primarily discusses the utilization of over-sampling and under-sampling – two core resampling techniques used to balance imbalanced datasets in Machine Learning (ML). Datasets with a significant skew towards one class over others can lead to biased model predictions. The implication of this analysis lies in the broader application of ML models and how effectively they can predict outcomes based on balanced data input.
Long-term Implications
- Improved Model Performance: With balanced data sets, machine learning models can deliver more reliable and accurate predictions, enhancing their overall performance.
- Better Decision-Making: As models become more precise, they support superior decision-making abilities in various fields, such as healthcare, finance, and logistics.
- Expanded Usage: As the science of balancing imbalanced data improves, it could lead to wider adoption of ML models in fields currently hindered by highly skewed datasets.
Possible Future Developments
- Advanced Resampling Techniques: Future progress may enhance resampling techniques, either by refining existing methods or inventing new ones.
- Automated Balancing: Automation of data balancing could become an integrated feature within ML platforms, reducing the need for manual intervention.
- Diversity of Data: Future advances may lead to models that can handle a more diverse range of data types, further expanding their applicability.
Actionable Insights
- Invest in Training: Provide continuous learning opportunities on resampling techniques to data scientists and ML practitioners for improving the model’s predictability.
- Leverage Tools: Use advanced tools and software solutions that offer built-in data balancing features to ease the data preparation task.
- Collaborate and Innovate: Encourage collaboration among ML practitioners and researchers for developing and sharing advanced resampling methods.
- Monitor Quality: Engage in constant monitoring of data quality. Investing in good quality data will ensure that models are robust and reliable.
Conclusion
Understanding and implementing resampling techniques can be an effective way to leverage machine learning solutions for a diverse range of applications. As we move towards a data-driven future, the handling of imbalanced datasets will remain a cornerstone for ML model improvement and innovation.
Read the original article
by jsendak | Apr 13, 2025 | DS Articles
[This article was first published on
R-posts.com, and kindly contributed to
R-bloggers]. (You can report issue about the content on this page
here)
Want to share your content on R-bloggers? click here if you have a blog, or here if you don’t.
In this blog, we explored how to set up cross-validation in R using the caret package, a powerful tool for evaluating machine learning models. Here’s a quick recap of what we covered:
-
Introduction to Cross-Validation:
-
Step-by-Step Setup:
-
We loaded the caret package and defined a cross-validation configuration using trainControl, specifying 10-fold repeated cross-validation with 5 repeats.
-
We also saved the configuration for reuse using saveRDS.
-
Practical Example:
-
Why It Matters:
-
Conclusion:
Let’s dive into the details!
1. Introduction to Cross-Validation
Cross-validation is a resampling technique used to assess the performance and generalizability of machine learning models. It helps address issues like overfitting and ensures that the model’s performance is consistent across different subsets of the data. By splitting the data into multiple folds and repeating the process, cross-validation provides a robust estimate of model performance.
2. Step-by-Step Cross-Validation Setup
Step 1: Load Necessary Library
Step 2: Define Train Control for Cross-Validation
train_control <- trainControl(
  method = "repeatedcv",      # Repeated cross-validation
  number = 10,                # 10 folds
  repeats = 5,                # 5 repeats
  savePredictions = "final"   # Save predictions for the final model
)
Step 3: Save Train Control Object
saveRDS(train_control, "./train_control_config.Rds")
3. Example: Cross-Validation in Action
Let’s walk through a practical example using a sample dataset.
Step 1: Load the Dataset
For this example, we’ll use the iris dataset, which is included in R.
Step 2: Define the Cross-Validation Configuration
library(caret)

# Define the cross-validation configuration
train_control <- trainControl(
  method = "repeatedcv",      # Repeated cross-validation
  number = 10,                # 10 folds
  repeats = 5,                # 5 repeats
  savePredictions = "final"   # Save predictions for the final model
)
Step 3: Train a Model Using Cross-Validation
We’ll train a simple k-nearest neighbors (KNN) model using cross-validation.
# Train a KNN model using cross-validation
set.seed(123)
model <- train(
  Species ~ .,                # Formula: Predict Species using all other variables
  data = iris,                # Dataset
  method = "knn",             # Model type: K-Nearest Neighbors
  trControl = train_control   # Cross-validation configuration
)

# View the model results
print(model)
Output:
k-Nearest Neighbors

150 samples
  4 predictor
  3 classes: 'setosa', 'versicolor', 'virginica'

No pre-processing
Resampling: Cross-Validated (10 fold, repeated 5 times)
Summary of sample sizes: 135, 135, 135, 135, 135, 135, ...
Resampling results across tuning parameters:

  k  Accuracy   Kappa
  5  0.9666667  0.95
  7  0.9666667  0.95
  9  0.9666667  0.95

Accuracy was used to select the optimal model using the largest value.
The final value used for the model was k = 5.
Step 4: Save the Cross-Validation Configuration
saveRDS(train_control, "./train_control_config.Rds")

# (Optional) Load the saved configuration
train_control <- readRDS("./train_control_config.Rds")
4. Why This Workflow Matters
This workflow ensures that your model is evaluated robustly and consistently. By using cross-validation, you can:
-
Avoid Overfitting: Cross-validation provides a more reliable estimate of model performance by testing on multiple subsets of the data.
-
Ensure Reproducibility: Saving the cross-validation configuration allows you to reuse the same settings in future analyses.
-
Improve Model Selection: Cross-validation helps you choose the best model by comparing performance across different configurations.
5. Conclusion
Cross-validation is an essential technique for evaluating machine learning models. By following this workflow, you can ensure that your models are robust, generalizable, and ready for deployment. Ready to try it out? Install the caret package and start setting up cross-validation in your projects today!
install.packages("caret")
library(caret)
Happy coding!
Setting Up Cross-Validation (caret package) in R: A Step-by-Step Guide was first posted on April 13, 2025 at 7:08 am.
Continue reading: Setting Up Cross-Validation (caret package) in R: A Step-by-Step Guide
Understanding Cross-Validation in R: Implications and Future Developments
The original blog post focuses on a step-by-step guide on how to set up cross-validation in R using the caret package. Techniques like cross-validation play a significant role in the realm of machine learning, providing a robust method to evaluate model performance and prevent overfitting. With the continuous advancement in technology, the implications and use of tools and languages such as R continue to grow.
Importance of Cross-Validation and ML Model Evaluation
While implementing machine learning models, cross-validation is crucial for the model’s performance evaluation. It safeguards against overfitting and validates the model’s generalizability by dividing the data into multiple subsets and assessing the model’s consistency across these different subsets. This process significantly aids in selecting the best possible model.
Over the coming years, as the amount and complexity of data increase, more robust evaluation methods like cross-validation will be in demand. Developers and organizations would need to ensure that their machine learning models are as reliable and accurate as possible. Reproducibility will also be an important aspect, allowing for model verification and easier debugging.
Long Term Implications and Potential Developments
In the long-term, there will be an increased emphasis on reproducibility. With the capacity to reuse the same settings for future analysis, development time reduces, while ensuring consistent results.
Machine learning tools and libraries are continuously being developed and improved. Therefore, we can expect future enhancements to the caret package, including more advanced techniques for conducting cross-validation and additional functionalities for improved model training, evaluation and selection.
Actionable Insights
For programmers and organizations to stay abreast with these implications, the following actions may prove beneficial:
- Continual Learning: Stay updated with the latest advancements in machine learning techniques, focusing on evaluation methods like cross-validation.
- Invest in Training: Understand the functionalities and working of R packages such as caret to effectively implement and evaluate ML models.
- Emphasize on Reproducibility: Adopt a workflow that allows for reproducibility enabling efficient debugging and testing.
- Prepare for Future: Be future-ready by staying aware of developments in ML tools and libraries.
Conclusion
Efficient model evaluation is a cornerstone to any machine learning task and cross-validation remains one of the most effective techniques to achieve this. It’s critical for developers and organizations to familiarize themselves with tools like R and its packages, and also keep pace with the rapid advancements in machine learning technology.
With its applications and implications in ML model evaluation, cross-validation seems to have a promising future with increased usability in more complex datasets, promising a consistently robust model performance.
Read the original article