by jsendak | Apr 7, 2025 | AI
arXiv:2504.02984v1 Announce Type: new
Abstract: Competitor analysis is essential in modern business due to the influence of industry rivals on strategic planning. It involves assessing multiple aspects and balancing trade-offs to make informed decisions. Recent Large Language Models (LLMs) have demonstrated impressive capabilities to reason about such trade-offs but grapple with inherent limitations such as a lack of knowledge about contemporary or future realities and an incomplete understanding of a market’s competitive landscape. In this paper, we address this gap by incorporating business aspects into LLMs to enhance their understanding of a competitive market. Through quantitative and qualitative experiments, we illustrate how integrating such aspects consistently improves model performance, thereby enhancing analytical efficacy in competitor analysis.
Enhancing Competitor Analysis with Business Aspects in Large Language Models (LLMs)
Competitor analysis plays a pivotal role in modern business, as it allows organizations to make informed decisions by assessing multiple aspects and balancing trade-offs. However, the advent of Large Language Models (LLMs) has introduced a new perspective to this process.
LLMs possess impressive capabilities to reason about trade-offs in competitor analysis. These models can process vast amounts of data, extract insights, and generate predictions. However, they do face limitations in their understanding of contemporary or future realities and their grasp of a market’s competitive landscape. This gap prevents them from providing a comprehensive analysis of competitors.
This paper proposes a solution to bridge this gap by incorporating business aspects into LLMs. By enhancing the models’ understanding of the competitive market, they can account for contextual factors and improve their analytical efficacy. By doing so, organizations can gain a more nuanced understanding of their competitors and make more accurate strategic decisions.
Quantitative and Qualitative Experiments
The authors conducted both quantitative and qualitative experiments to validate the effectiveness of integrating business aspects into LLMs. These experiments provide insights into the enhanced performance of the models and how they contribute to better competitor analysis.
In the quantitative experiments, the researchers compared the performance of LLMs with and without the incorporation of business aspects. They measured various metrics such as precision, recall, and accuracy to assess the models’ performance in competitor analysis tasks. The results consistently showed that integrating business aspects led to improved model performance.
The qualitative experiments further supplemented the quantitative findings by providing a more nuanced understanding of the models’ capabilities. Through case studies and real-world scenarios, the authors demonstrated how the integrated LLMs could identify market trends, anticipate competitor strategies, and provide actionable insights. These experiments highlighted the multi-disciplinary nature of competitor analysis, where a deep understanding of business concepts is required to extract meaningful insights.
The Multi-Disciplinary Nature of Competitor Analysis
This paper also emphasizes the multi-disciplinary nature of competitor analysis and the importance of integrating domain-specific knowledge into LLMs. Competitor analysis goes beyond traditional linguistic understanding and requires a comprehensive grasp of business concepts, market dynamics, and strategic planning.
By enriching LLMs with business aspects, organizations can benefit from the synergy of natural language processing and business intelligence. This interdisciplinary approach allows LLMs to leverage their language processing capabilities while incorporating domain-specific knowledge to provide more accurate and actionable insights.
Future Directions
While this paper provides a promising advancement in competitor analysis by incorporating business aspects into LLMs, there are avenues for further research and development. Future studies could explore the impact of additional contextual factors, such as macroeconomic trends, regulatory environments, and customer preferences, on the models’ performance.
Furthermore, ensuring the ethical use of LLMs in competitor analysis is critical. As these models become more powerful, organizations must address concerns related to data privacy, bias, and fairness. Collaborations between experts in NLP, business strategy, and ethics will be essential in developing guidelines and best practices for using LLMs responsibly in competitor analysis.
Key Takeaways:
- Integrating business aspects into Large Language Models (LLMs) enhances their understanding of a competitive market in competitor analysis.
- Quantitative experiments demonstrate improved model performance when incorporating business aspects.
- Qualitative experiments showcase the nuanced insights LLMs can provide in competitor analysis tasks.
- The multi-disciplinary nature of competitor analysis emphasizes the need for domain-specific knowledge to complement language processing capabilities.
- Future research could explore the impact of additional contextual factors on LLMs’ performance and address ethical considerations.
Read the original article
by jsendak | Apr 5, 2025 | DS Articles

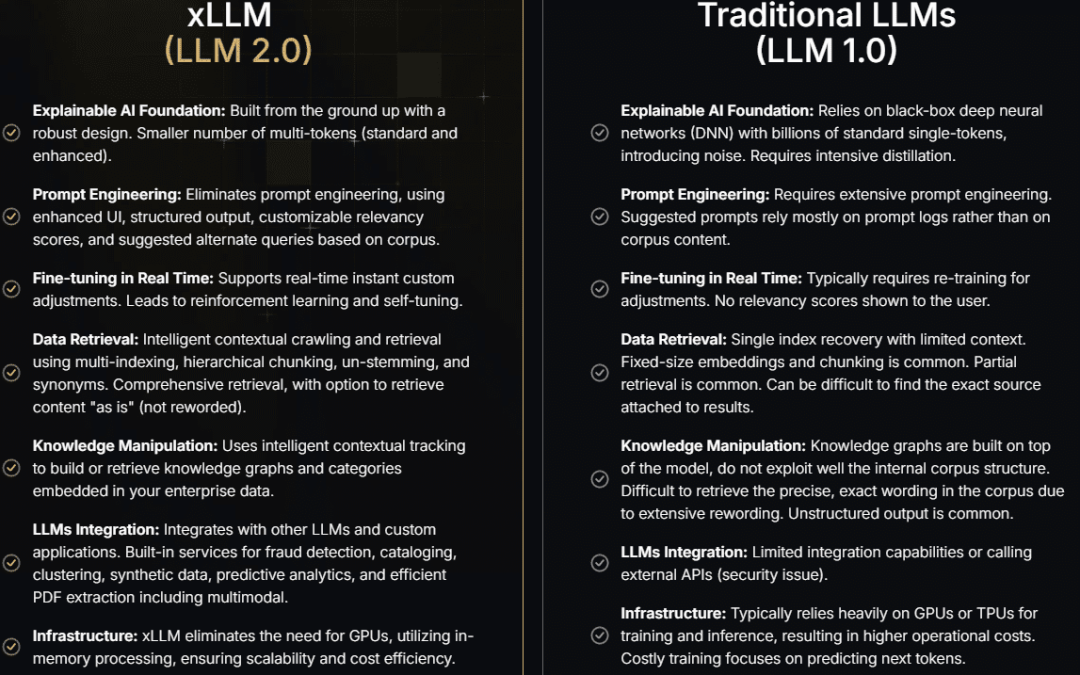
The Rise of Specialized LLMs for Enterprise | LLMs with Billions of Parameters | LLM 2.0, The NextGen AI Systems for Enterprise
Unpacking the Rise of Specialized LLMs
Large Language Models (LLMs) are revolutionizing business operations, giving rise to a new breed of specialized models for enterprises. The development of LLMs with billions of parameters – dubbed ‘LLM 2.0’ – reflects the next generation of AI systems designed for business, boasting potential implications for productivity, innovation, and efficiency.
Long-term Implications and Future Developments
LLMs have immense potential to transform how businesses operate. However, with their evolution to specialized LLMs and the introduction of LLM 2.0, the enterprise sector can anticipate some significant changes.
Improved Business Efficiency
Specialized LLMs can automate many routine tasks, such as managing emails, writing reports, and filling out forms. This automation can lead to greater efficiency, freeing up employee time to focus on more strategic and creative tasks.
Increased Innovation
LLMs ability to process vast amounts of data and generate models can spur innovation across industries. Businesses can use these models to uncover new insights, make predictions, and develop new products and services.
Enhanced Personalization
Given their capability to learn and adapt, specialized LLMs can deliver highly personalized experiences. From tailoring product recommendations to crafting personalized messages, LLMs can engage customers in a more meaningful way.
Anticipating Challenges
While the rise of specialized LLMs presents exciting opportunities, it also poses new challenges. Developing and managing these complex models require significant resources and expertise. Moreover, as LLMs become more sophisticated, issues related to privacy and security cannot be overlooked.
Actionable Advice for Enterprises
To leverage the potential of LLM 2.0 and specialized LLMs, businesses should consider the following:
- Invest in AI training: Staff should be trained in basic AI understanding and its implementation in the business setting.
- Collaborate with AI experts: Partner with AI experts or hire in-house talent to manage and optimize specialized LLMs.
- Set appropriate security measures: Develop robust security protocols to safeguard data and machine learning models.
- Focus on data privacy: Be transparent about how you collect, store, and use customer data and ensure compliance with regulations.
In summary, the emergence of specialized LLMs and the upgrade to LLM 2.0 present transformative opportunities for enterprises across industries. However, organizations must also anticipate and address potential challenges to make the most of these developments.
Read the original article
by jsendak | Mar 29, 2025 | DS Articles
[This article was first published on
R Works, and kindly contributed to
R-bloggers]. (You can report issue about the content on this page
here)
Want to share your content on R-bloggers? click here if you have a blog, or here if you don’t.
In February, one hundred fifty-nine new packages made it to CRAN. Here are my Top 40 picks in fifteen categories: Artificial Intelligence, Computational Methods, Ecology, Genomics, Health Sciences, Mathematics, Machine Learning, Medicine, Music, Pharma, Statistics, Time Series, Utilities, Visualization, and Weather.
Artificial Intelligence
chores v0.1.0: Provides a collection of ergonomic large language model assistants designed to help you complete repetitive, hard-to-automate tasks quickly. After selecting some code, press the keyboard shortcut you’ve chosen to trigger the package app, select an assistant, and watch your chore be carried out. Users can create custom helpers just by writing some instructions in a markdown file. There are three vignettes: Getting started, Custom helpers, and Gallery.
gander v0.1.0: Provides a Copilot completion experience that knows how to talk to the objects in your R environment. ellmer chats are integrated directly into your RStudio and Positron sessions, automatically incorporating relevant context from surrounding lines of code and your global environment. See the vignette to get started.
GitAI v0.1.0: Provides functions to scan multiple Git repositories, pull content from specified files, and process it with LLMs. You can summarize the content, extract information and data, or find answers to your questions about the repositories. The output can be stored in a vector database and used for semantic search or as a part of a RAG (Retrieval Augmented Generation) prompt. See the vignette.
Computational Methods
nlpembeds v1.0.0: Provides efficient methods to compute co-occurrence matrices, point wise mutual information (PMI), and singular value decomposition (SVD), especially useful when working with huge databases in biomedical and clinical settings. Functions can be called on SQL databases, enabling the computation of co-occurrence matrices of tens of gigabytes of data, representing millions of patients over tens of years. See Hong (2021) for background and the vignette for examples.
NLPwavelet v1.0: Provides functions for Bayesian wavelet analysis using individual non-local priors as described in Sanyal & Ferreira (2017) and non-local prior mixtures as described in Sanyal (2025). See README to get started.
pnd v0.0.9: Provides functions to compute numerical derivatives including gradients, Jacobians, and Hessians through finite-difference approximations with parallel capabilities and optimal step-size selection to improve accuracy. Advanced features include computing derivatives of arbitrary order. There are three vignettes on the topics: Compatibility with numDeriv, Parallel numerical derivatives, and Step-size selection.
rmcmc v0.1.1: Provides functions to simulate Markov chains using the proposal from Livingstone and Zanella (2022) to compute MCMC estimates of expectations with respect to a target distribution on a real-valued vector space. The package also provides implementations of alternative proposal distributions, such as (Gaussian) random walk and Langevin proposals. Optionally, BridgeStan’s R interface BridgeStan can be used to specify the target distribution. There is an Introduction to the Barker proposal and a vignette on Adjusting the noise distribution.
sgdGMF v1.0: Implements a framework to estimate high-dimensional, generalized matrix factorization models using penalized maximum likelihood under a dispersion exponential family specification, including the stochastic gradient descent algorithm with a block-wise mini-batch strategy and an efficient adaptive learning rate schedule to stabilize convergence. All the theoretical details can be found in Castiglione et al. (2024). Also included are the alternated iterative re-weighted least squares and the quasi-Newton method with diagonal approximation of the Fisher information matrix discussed in Kidzinski et al. (2022). There are four vignettes, including introduction and residuals.
Data
acledR v0.1.0: Provides tools for working with data from ACLED (Armed Conflict Location and Event Data). Functions include simplified access to ACLED’s API, methods for keeping local versions of ACLED data up-to-date, and functions for common ACLED data transformations. See the vignette to get started.
Horsekicks v1/0/2: Provides extensions to the classical dataset Death by the kick of a horse in the Prussian Army first used by Ladislaus von Bortkeiwicz in his treatise on the Poisson distribution Das Gesetz der kleinen Zahlen. Also included are deaths by falling from a horse and by drowning. See the vignette.
OhdsiReportGenerator v1.0.1: Extracts results from the Observational Health Data Sciences and Informatics result database and generates Quarto reports and presentations. See the package guide.
wbwdi v1.0.0: Provides functions to access and analyze the World Bank’s World Development Indicators (WDI) using the corresponding API. WDI provides more than 24,000 country or region-level indicators for various contexts. See the vignette.
Ecology
rangr v1.0.6: Implements a mechanistic virtual species simulator that integrates population dynamics and dispersal to study the effects of environmental change on population growth and range shifts. Look here for background and see the vignette to get started.
Economics
godley v0.2.2: Provides tools to define, simulate, and validate stock-flow consistent (SFC) macroeconomic models by specifying governing systems of equations. Users can analyze how macroeconomic structures affect key variables, perform sensitivity analyses, introduce policy shocks, and visualize resulting economic scenarios. See Godley and Lavoie (2007), Kinsella and O’Shea (2010) for background and the vignette to get started.
Health Sciences
matriz v1.0.1: Implements a workflow that provides tools to create, update, and fill literature matrices commonly used in research, specifically epidemiology and health sciences research. See README to get started.
Mathematics
flint v0.0.3: Provides an interface to FLINT, a C library for number theory which extends GNU MPFR and GNU MP with support for arithmetic in standard rings (the integers, the integers modulo n, the rational, p-adic, real, and complex numbers) as well as vectors, matrices, polynomials, and power series over rings and implements midpoint-radius interval arithmetic, in the real and complex numbers See Johansson (2017) for information on computation in arbitrary precision with rigorous propagation of errors and see the NIST Digital Library of Mathematical Functions for information on additional capabilities. Look here to get started.
Machine Learning
tall v0.1.1: Implements a general-purpose tool for analyzing textual data as a shiny application with features that include a comprehensive workflow, data cleaning, preprocessing, statistical analysis, and visualization. See the vignette.
“}
Medicine
BayesERtools v0.2.1: Provides tools that facilitate exposure-response analysis using Bayesian methods. These include a streamlined workflow for fitting types of models that are commonly used in exposure-response analysis – linear and Emax for continuous endpoints, logistic linear and logistic Emax for binary endpoints, as well as performing simulation and visualization. Look here to learn more about the workflow, and see the vignette for an overview.
Medicine Continued
PatientLevelPrediction v6.4.0: Implements a framework to create patient-level prediction models using the Observational Medical Outcomes Partnership Common Data Model. Given a cohort of interest and an outcome of interest, the package can use data in the Common Data Model to build a large set of features, which can then be used to fit a predictive model with a number of machine learning algorithms. This is further described in Reps et al. (2017). There are fourteen vignettes, including Building Patient Level Prediction Models and Best Practices.
SimTOST v1.0.2: Implements a Monte Carlo simulation approach to estimating sample sizes, power, and type I error rates for bio-equivalence trials that are based on the Two One-Sided Tests (TOST) procedure. Users can model complex trial scenarios, including parallel and crossover designs, intra-subject variability, and different equivalence margins. See Schuirmann (1987), Mielke et al. (2018), and Shieh (2022) for background. There are seven vignettes including Introduction and Bioequivalence Tests for Parallel Trial Designs: 2 Arms, 1 Endpoint.
Music
musicXML v1.0.1: Implements tools to facilitate data sonification and create files to share music notation in the musicXML format. Several classes are defined for basic musical objects such as note pitch, note duration, note, measure, and score. Sonification functions map data into musical attributes such as pitch, loudness, or duration. See the blog and Renard and Le Bescond (2022) for examples and the vignette to get started.
Pharma
emcAdr v1.2: Provides computational methods for detecting adverse high-order drug interactions from individual case safety reports using statistical techniques, allowing the exploration of higher-order interactions among drug cocktails. See the vignette.
SynergyLMM v1.0.1: Implements a framework for evaluating drug combination effects in preclinical in vivo studies, which provides functions to analyze longitudinal tumor growth experiments using linear mixed-effects models, perform time-dependent analyses of synergy and antagonism, evaluate model diagnostics and performance, and assess both post-hoc and a priori statistical power. See Demidenko & Miller (2019 for the calculation of drug combination synergy and Pinheiro and Bates (2000) and Gałecki & Burzykowski (2013) for information on linear mixed-effects models. The vignette offers a tutorial.
vigicaen v0.15.6: Implements a toolbox to perform the analysis of the World Health Organization (WHO) Pharmacovigilance database, VigiBase, with functions to load data, perform data management, disproportionality analysis, and descriptive statistics. Intended for pharmacovigilance routine use or studies. There are eight vignettes, including basic workflow and routine pharmacoviligance.
Psychology
cogirt v1.0.0: Provides tools to psychometrically analyze latent individual differences related to tasks, interventions, or maturational/aging effects in the context of experimental or longitudinal cognitive research using methods first described by Thomas et al. (2020). See the vignette.
Statistics
DiscreteDLM v1.0.0: Provides tools for fitting Bayesian distributed lag models (DLMs) to count or binary, longitudinal response data. Count data are fit using negative binomial regression, binary are fit using quantile regression. Lag contribution is fit via b-splines. See Dempsey and Wyse (2025) for background and README for examples.
oneinfl v1.0.1: Provides functions to estimate Estimates one-inflated positive Poisson, one-inflated zero-truncated negative binomial regression models, positive Poisson models, and zero-truncated negative binomial models along with marginal effects and their standard errors. The models and applications are described in Godwin (2024). See README for and example.
Time Series
BayesChange v2/0/0: Provides functions for change point detection on univariate and multivariate time series according to the methods presented by Martinez & Mena (2014) and Corradin et al. (2022) along with methods for clustering time dependent data with common change points. See Corradin et. al. (2024). There is a tutorial.
echos v1.0.3: Provides a lightweight implementation of functions and methods for fast and fully automatic time series modeling and forecasting using Echo State Networks. See the vignettes Base functions and Tidy functions.
quadVAR v0.1.2: Provides functions to estimate quadratic vector autoregression models with the strong hierarchy using the Regularization Algorithm under Marginality Principle of Hao et al. (2018) to compare the performance with linear models and construct networks with partial derivatives. See README for examples.
Utilities
aftables v1.0.2: Provides tools to generate spreadsheet publications that follow best practice guidance from the UK government’s Analysis Function. There are four vignettes, including an Introduction and Accessibility.
watcher v0.1.2: Implements an R binding for libfswatch, a file system monitoring library, that enables users to watch files or directories recursively for changes in the background. Log activity or run an R function every time a change event occurs. See the README for an example.
Visualization
jellyfisher v1.0.4: Generates interactive Jellyfish plots to visualize spatiotemporal tumor evolution by integrating sample and phylogenetic trees into a unified plot. This approach provides an intuitive way to analyze tumor heterogeneity and evolution over time and across anatomical locations. The Jellyfish plot visualization design was first introduced by Lahtinen et al. (2023). See the vignette.
xdvir v0.1-2: Provides high-level functions to render LaTeX fragments as labels and data symbols in ggplot2 plots, plus low-level functions to author, produce, and typeset LaTeX documents, and to produce, read, and render DVIfiles. See the vignette.
Weather
RFplus v1.4-0: Implements a machine learning algorithm that merges satellite and ground precipitation data using Random Forest for spatial prediction, residual modeling for bias correction, and quantile mapping for adjustment, ensuring accurate estimates across temporal scales and regions. See the vignette.
SPIChanges v0.1.0: Provides methods to improve the interpretation of the Standardized Precipitation Index under changing climate conditions. It implements the nonstationary approach of Blain et al. (2022) to detect trends in rainfall quantities and quantify the effect of such trends on the probability of a drought event occurring. There is an Introduction and a vignette Monte Carlo Experiments and Case Studies.
Continue reading: February 2025 Top 40 New CRAN Packages
Analysis and Future Implications of February 2025 New CRAN Packages
Over the course of February 2025, 159 new packages made it to the Comprehensive R Archive Network (CRAN). With immense advancements in dynamic fields such as Artificial Intelligence, Genomics, Machine Learning and others, this represents another leap into a future powered by groundbreaking data-analytics too. But what does this mean for users of these packages? What longer-term implications do these hold?
Artificial Intelligence-Based Packages
Artificial Intelligence has shown significant advancements recently. The newly released packages, such as chores v0.1.0, gander v0.1.0, and GitAI v0.1.0, showcase versatile features like language model assistants, Copilot completion experience, and functions to scan Git repositories. Considering the increasing importance of automating tasks and the capabilities these packages offer, they’re expected to gain more popularity.
Actionable Advice:
Artificial Intelligence is an ever-evolving field. Stay updated with the latest advancements like large language models and more efficient programming. Learning to use new packages like chores, gander, and GitAI could help improve efficiency in automating tasks.
Computational Methods-Based Packages
New tools like nlpembeds v1.0.0, NLPwavelet v1.0, and rmcmc v0.1.1 are milestones in Computational Methods’ evolution. Such packages demonstrate the community’s focusing on computation efficiency and modeling, even with very large data sets.
Actionable Advice:
Consider updating your skills to effectively handle large volumes of data and make sense of complex data sets using packages like nlpembeds and rmcmc.
Data Packages
Twelve new data packages, including acledR v0.1.0 and Horsekicks v1/0/2, provide the community with preloaded datasets and functions to handle specific types of data efficiently. They offer potential to researchers to undertake complex studies without the hassle of preprocessing big data.
Actionable Advice:
Stay updated with the latest data packages available on CRAN to improve the efficiency of your studies and to provide a robust framework for your research.
Machine Learning Packages
A new package like tall v0.1.1 implies a user-friendly approach to analyzing textual data using machine learning. This shows a clear trend towards user-friendly, visual, and interactive tools for applied machine learning in textual data analysis.
Actionable Advice:
As a data scientist or analyst, consider deploying machine learning tools like tall in your work. It would streamline the process of extracting insights from raw textual data.
Visualization Packages
Visualization tools like jellyfisher v1.0.4 and xdvir v0.1-2 provide intuitive ways to analyze and present data, which is a crucial aspect of data analysis.
Actionable Advice:
Should you be presenting complex data sets to an audience, consider using such visualization tools to simplify consumption and interpretation.
Long-term Implications and Future Developments
CRAN’s latest package releases suggest exciting developments in fields of Artificial Intelligence, Computational Methods, Machine Learning, Data and Visualization. With the pace at which these fields are growing, professionals relying on data analysis and researchers should anticipate even more sophisticated tools and computations in the pipeline. This further indicates a clear need to keep up with understanding and ability to deploy these constantly evolving tools.
Actionable Advice:
Continually learning and applying newly released packages should be a part of your long-term strategy. This will ensure you stay ahead in the data science world, leveraging the most effective and sophisticated tools at your disposal.
Read the original article
by jsendak | Mar 15, 2025 | DS Articles
Abstract Large Language Models (LLMs) are a natural language processing tool under the category of generative artificial intelligence. They have the power to transform the insurance and reinsurance industries by improving a multitude of processes. While both sectors benefit from AI advancements, their distinct structures necessitate different applications of LLMs. This paper explores the role… Read More »Leveraging GenAI and LLMs in the insurance and reinsurance domains
Understanding AI and LLMs in the Insurance and Reinsurance Industries
Larger Language Models (LLMs) are a subset of Generative Artificial Intelligence tools. They are known for their potential to create substantial improvements in varying processes across different sectors. The insurance and reinsurance industries are just two of many spheres where LLMs can wield considerable impact, but the specific applications of these models vary due to unique structures of both sectors.
Potential Impact on Insurance and Reinsurance
Tapping into the capabilities of LLMs can augment efficiency, speed, and accuracy in numerous insurance and reinsurance process like policy underwriting, claims processing, fraud detection, risk assessment, customer service, and others.
The Need for Customised Applications
While both sectors stand to gain significantly from LLMs, it’s important to remember that the unique structures of insurance and reinsurance require custom-tailored applications of these models. The interactions of an insurance company with policyholders, for instance, are very different from a reinsurance company’s interactions with insurers, thus necessitating different LLM applications.
Long-term Implications and Future Developments
As the use of LLMs becomes more prevalent in industries such as insurance and reinsurance, we can expect a cascade of long-term effects. Here are a few potential implications to consider:
- Improved Efficiency: With the capability to automate and streamline processes, LLMs could vastly improve operational efficiency in both sectors.
- Increased Accuracy: LLMs’ ability to analyse and learn from large volumes of text-based data can enhance risk assessment accuracy.
- Better Customer Service: By automating customer interactions with AI chatbots, these models can provide faster, more accurate customer service.
- Reduced Fraud: Predictive analysis could enable LLMs to identify patterns of fraudulent activity, potentially reducing future fraud cases.
These implications, among others, could lead to widespread changes across the industry, transforming the way insurance and reinsurance companies operate.
Actionable Advice Based on These Insights
Invest in AI and LLM Technology
Insurance and reinsurance firms should invest in AI and LLM technology. Doing so will not only improve efficiency but also enhance the accuracy of their services, reduce potential fraudulent claims and enhance customer service.
Customize AI Applications
Because the structures of insurance and reinsurance companies differ significantly, firms should work towards customizing LLM applications to suit their individual needs.
Training and Development
Firms should provide adequate training and development for their own team on the use and applications of LLMs. This will equip them with the understanding and skills to leverage these technologies in the most effective ways.
Stay Updated with AI Advancements
Lastly, businesses should stay abreast of the latest advancements in the field of AI and LLMs. This will ensure that they continue to benefit from innovations in the sector and can compete effectively in a rapidly digitalizing world.
Read the original article
by jsendak | Feb 27, 2025 | AI
arXiv:2502.18531v1 Announce Type: new
Abstract: Background: Recruitment for cohorts involving complex liver diseases, such as hepatocellular carcinoma and liver cirrhosis, often requires interpreting semantically complex criteria. Traditional manual screening methods are time-consuming and prone to errors. While AI-powered pre-screening offers potential solutions, challenges remain regarding accuracy, efficiency, and data privacy. Methods: We developed a novel patient pre-screening pipeline that leverages clinical expertise to guide the precise, safe, and efficient application of large language models. The pipeline breaks down complex criteria into a series of composite questions and then employs two strategies to perform semantic question-answering through electronic health records – (1) Pathway A, Anthropomorphized Experts’ Chain of Thought strategy, and (2) Pathway B, Preset Stances within an Agent Collaboration strategy, particularly in managing complex clinical reasoning scenarios. The pipeline is evaluated on three key metrics-precision, time consumption, and counterfactual inference – at both the question and criterion levels. Results: Our pipeline achieved high precision (0.921, in criteria level) and efficiency (0.44s per task). Pathway B excelled in complex reasoning, while Pathway A was effective in precise data extraction with faster processing times. Both pathways achieved comparable precision. The pipeline showed promising results in hepatocellular carcinoma (0.878) and cirrhosis trials (0.843). Conclusions: This data-secure and time-efficient pipeline shows high precision in hepatopathy trials, providing promising solutions for streamlining clinical trial workflows. Its efficiency and adaptability make it suitable for improving patient recruitment. And its capability to function in resource-constrained environments further enhances its utility in clinical settings.
Expert Commentary: Streamlining Clinical Trial Workflows with AI-Powered Patient Pre-Screening
In the field of clinical research, patient recruitment for complex liver diseases such as hepatocellular carcinoma and liver cirrhosis can be a challenging task. The traditional manual screening methods are not only time-consuming but also prone to human errors. However, the advent of AI-powered pre-screening offers potential solutions to these challenges.
This article introduces a novel patient pre-screening pipeline that leverages clinical expertise to guide the precise, safe, and efficient application of large language models. The pipeline breaks down complex criteria into a series of composite questions and then applies two strategies to perform semantic question-answering through electronic health records.
Multi-disciplinary Nature of the Concepts
This research effort combines expertise from multiple disciplines, including clinical medicine, artificial intelligence, and natural language processing. It demonstrates the integration of clinical knowledge and technological advancements to address the specific challenges associated with patient recruitment in complex liver disease trials.
The pipeline’s approach to breaking down complex criteria shows the influence of clinical expertise in designing effective questions that extract the relevant information from electronic health records. At the same time, the utilization of large language models powered by AI demonstrates the significance of cutting-edge technology in achieving precise and efficient results.
Pathway A: Anthropomorphized Experts’ Chain of Thought Strategy
This strategy employed in the pipeline focuses on mimicking the reasoning process of human experts. By breaking down complex clinical reasoning scenarios into a series of questions, it facilitates precise data extraction from electronic health records. Pathway A shows the potential to assist in automating the understanding and interpretation of complex medical information, reducing the burden on human experts and improving the efficiency of patient pre-screening.
Pathway B: Preset Stances within an Agent Collaboration Strategy
Pathway B, on the other hand, utilizes the collaboration between an agent and the clinical experts to tackle complex reasoning scenarios. This strategy acknowledges the limitations of fully automated approaches and emphasizes the importance of human input in handling intricate clinical situations. By combining the insights and expertise of both machine and human, Pathway B enhances the accuracy of semantic question-answering and provides a valuable approach for managing complex clinical reasoning.
Evaluation Metrics and Results
The pipeline’s evaluation metrics include precision, time consumption, and counterfactual inference at both the question and criterion levels. The results indicate high precision (0.921 at the criterion level) and efficiency (0.44 seconds per task) of the pipeline. This suggests that the pipeline is capable of accurately extracting relevant information from electronic health records and processing it in a timely manner.
Importantly, the pipeline’s promising results in the specific contexts of hepatocellular carcinoma and cirrhosis trials (achieving precision rates of 0.878 and 0.843, respectively) highlight its potential in advancing the recruitment process for these complex liver diseases. The ability of the pipeline to handle different diseases showcases its adaptability and generalizability, making it a suitable tool for improving patient recruitment in various clinical trial workflows.
Promising Solutions for Streamlining Clinical Trial Workflows
This data-secure and time-efficient patient pre-screening pipeline holds great promise for streamlining clinical trial workflows. By automating the screening process and reducing the manual effort required, the pipeline can expedite patient recruitment and enhance the efficiency of clinical trials. Its precision and adaptability further contribute to its utility in diverse clinical settings.
The multi-disciplinary nature of this research effort highlights the importance of collaboration between clinical experts and technology specialists. Moving forward, further research could focus on refining the pipeline’s accuracy, exploring its potential in other disease areas, and addressing any data privacy concerns. Overall, the integration of AI-powered patient pre-screening in clinical trials opens new avenues for improving healthcare outcomes and advancing medical research.
Read the original article


 “}
“}