Learn about the importance of color in data visualization. Understand its power in conveying insights effectively and engaging your audience.
Understanding the Role of Color in Data Visualization
Color in data visualization is a remarkable tool that significantly enhances the comprehension of complex datasets. This fundamental feature plays crucial roles in conveying data insights effectively and engaging with the audience.
The Long-term Implications of Color in Data Visualization
The use of color in data visualizations has potent long-term implications in various sectors including; business, education, healthcare, and technology among other domains. By simplifying the understanding of complex data sets, color enhances decision-making processes, problem-solving, and strategy formulation that is data-driven.
In Education, clearer visual representation leads to better understanding and information retention. In Business, it promotes strategic planning and marketing as trends and patterns are detected more easily. Technology and healthcare services are also becoming more reliant on data. Hence, the need for effective visualization tools for easier interpretation and decision making.
Effective Color Schemes Enhance Accessibility
Another critical long-term effect is the improved accessibility of data. When colors are utilized effectively, they can enhance the readability of the visual representation for individuals with certain visual impairments. Thus, promoting inclusivity in data readability.
Potential Future Developments
As the demand for data interpretation continues to grow, there will be more advancements in the field of data visualization. In the future, we anticipate a deeper research and development into dynamic color schemes that adapt to certain parameters and variables. This will enable more personalized data experiences.
Another likely development is the creation of automated color selection algorithms that can choose the best colors for each dataset based on several factors such as the type of data, the intended audience, and the specific message the data conveys. This will eliminate the need for manual color selection, thereby making data visualization more efficient.
Actionable Advice
As color plays an instrumental role in data visualization, it is essential to follow some practices and techniques:
Choose a color scheme that fits your data: Always select colors that better represent your data and its variables. For example, if illustrating data about the environment, greens and blues may be more effective.
Ensure readability: Make sure your colors are visible and can be distinguished from each other. Contrasting colors often work best for this purpose.
Consider colorblind-friendly palettes: Not everyone sees colors the same way. Therefore, it’s important to consider colorblind-friendly palettes to ensure inclusivity and accessibility.
Keep it simple: Avoid using too many colors as it can create confusion. Stick to a pallet of 2-10 colors. Remember, the aim is to improve comprehension, not to create a piece of art.
In conclusion, the power of color in data visualization should not be underestimated. When used properly, it can greatly enrich the way data is perceived and interpreted, hence leading to better decision-making processes.
[This article was first published on R Consortium, and kindly contributed to R-bloggers]. (You can report issue about the content on this page here)
Want to share your content on R-bloggers? click here if you have a blog, or here if you don’t.
Last year, R Consortium talked to John Blischak and Tim Hoolihan of the Cleveland R User Group about their regular structured and casual virtual meetups during the pandemic. Recently, Alec Wong, another co-organizer of the Cleveland R User Group, updated the R Consortium about how the group provides a networking platform for a small but vibrant local R community. Alec shared details of a recent event from the group regarding the use of R for analyzing baseball data. He also discussed some tools for keeping the group inclusive and improving communication among group members.
Please share about your background and involvement with the RUGS group.
I completed my Bachelor of Science degree in Fisheries and Wildlife from the University of Nebraska-Lincoln in 2013, and my Master of Science degree in Statistical Ecology from Cornell University in late 2018. During my graduate program, I gained extensive experience using R, which is the de facto language of the ecological sciences. I discovered a passion for the language, as it is extremely intuitive and pleasant to work with.
After completing my program in 2018, I moved to Cleveland and immediately began attending the Cleveland R User Group in 2019, and have been a consistent member ever since. I eagerly look forward to each of our events.
After completing my graduate program, I started working at Progressive Insurance. Working for a large organization like Progressive provides me with many diverse opportunities to make use of my extensive experience with R. I was happy to find a vibrant R community within the company, which allowed me to connect with other R users, share knowledge, and I enthusiastically offer one-on-one assistance to analysts from all over Progressive.
Starting in 2022, I accepted the role of co-organizer of the Cleveland R User Group. As a co-organizer, I help with various tasks related to organizing events, such as the one we held last September. I am passionate about fostering the growth of these communities and helping to attract more individuals who enjoy using R.
Our group events are currently being held in a hybrid format. When we manage to find space, we will meet in person, such as when we met to view the 2023 posit::conf in October–several members visited in person and watched and discussed videos from the conference. Most of our meetups continue to be virtual, including our Saturday morning coffee meetups, but we are actively searching for a more permanent physical space to accommodate our regular meetups.
I am only one of several co-organizers of the Cleveland R user group. The other co-organizers include Tim Hoolihan from Centric Consulting, John Blischak who operates his consulting firm JDB Software Consulting, LLC, and Jim Hester, currently a Senior Software Engineer at Netflix. Their contributions are invaluable and the community benefits tremendously from their efforts.
Can you share what the R community is like in Cleveland?
I believe interest in R has been fairly steady over time in Cleveland since 2019. We have a handful of members who attend regularly, and typically each meeting one or two new attendees will introduce themselves.
I would venture to say that R continues to be used frequently in academic settings in Cleveland, though I am unfamiliar with the standards at local universities. At least two of our members belong to local universities and they use R in their curricula.
As for industry usage, many local companies, including Progressive use R. At Progressive, we have a small, but solid R community; although it is not as large as the Python community, I believe that the R community is more vibrant. This seems characteristic of R communities in varying contexts, as far as I’ve seen. Another Cleveland company, the Cleveland Guardians baseball team, makes use of R for data science. In September 2023 we were fortunate to invite one of their principal data scientists to speak to us about their methods and analyses. (More details below.)
Typically, our attendance is local to the greater Cleveland area, but with virtual meetups, we’ve been able to host speakers and attendees from across the country; this was a silver lining of the pandemic. We also hold regular Saturday morning coffee and informal chat sessions, and it’s great to see fresh faces from outside Cleveland joining in.
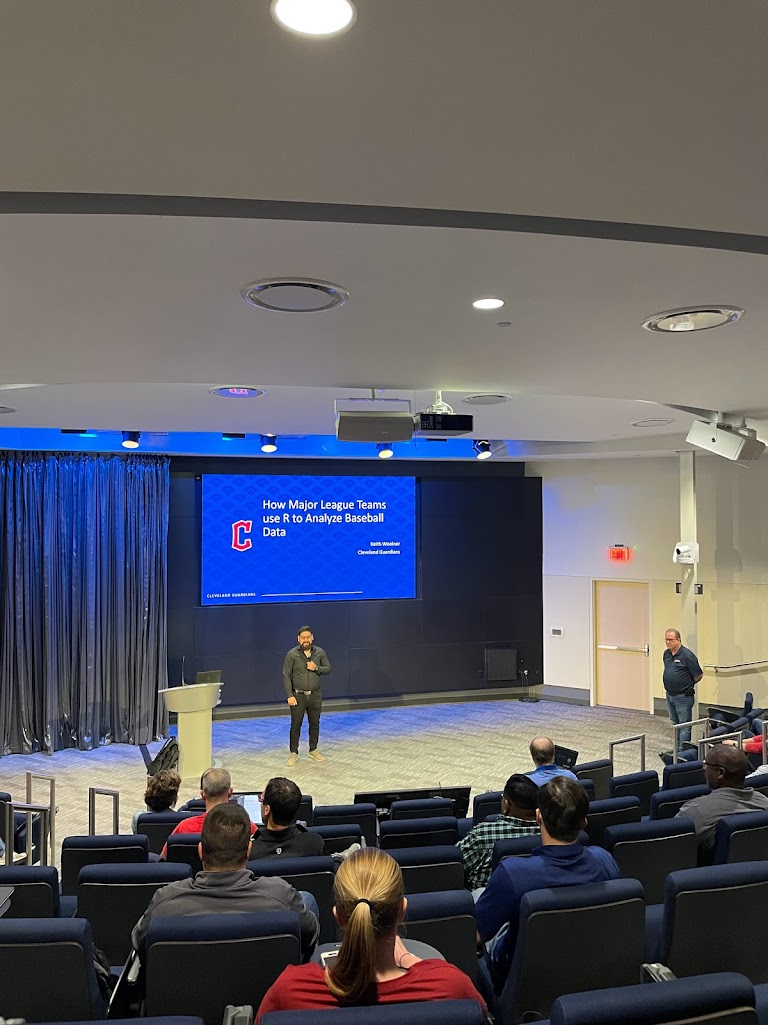
On September 27th, 2023, we invited Keith Woolner, principal data scientist at the Cleveland Guardians baseball team, to give a presentation to our group. This was our first in-person meetup after the pandemic, and Progressive generously sponsored our event, affording us a large presentation space, food, and A/V support. We entertained a mixed audience from the public as well as Progressive employees.
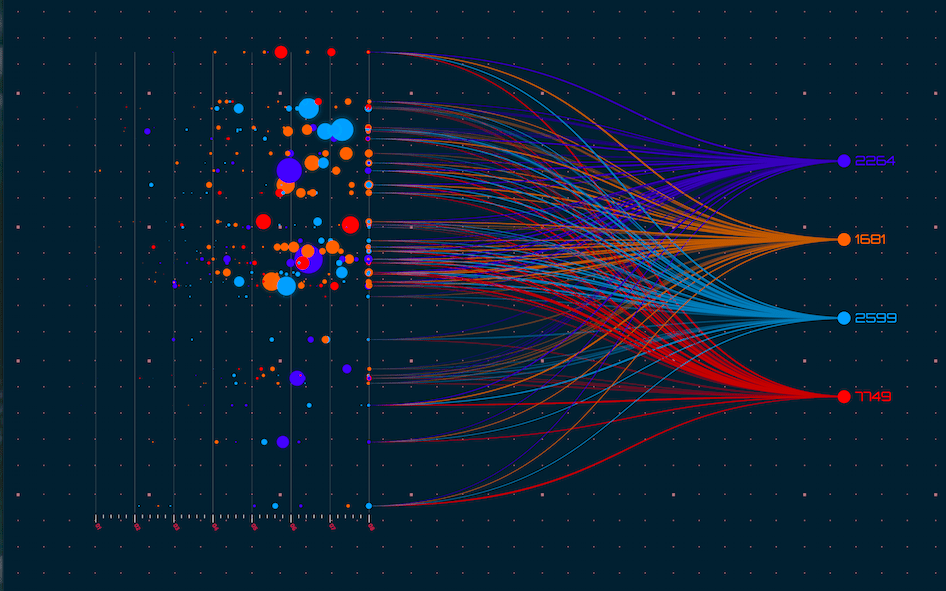
Keith spoke to us about “How Major League Baseball Teams Use R to Analyze Baseball Data.” In an engaging session, he showcased several statistical methods used in sports analytics, the code used to produce these analyses, and visualizations of the data and statistical methods. Of particular interest to me was his analysis using a generalized additive model (GAM) to evaluate the relative performance of catchers’ ability to “frame” a catch; in other words, their ability to convince the umpire a strike occurred. The presentation held some relevance for everyone, whether they were interested in Cleveland baseball, statistics, or R, making it a terrific option for our first in-person presentation since January 2020. His presentation drove a lot of engagement both during and after the session.
Any techniques you recommend using for planning for or during the event? (Github, zoom, other) Can these techniques be used to make your group more inclusive to people that are unable to attend physical events in the future?
One of our co-organizers, John Blischak, has created a slick website using GitHub Pages to showcase our group and used GitHub issue templates to create a process for speakers to submit talks. Additionally, the Cleveland R User group has posted recordings of our meetups to YouTube since 2017, increasing our visibility and accessibility. Many people at Progressive could not attend our September meetup and asked for the recording of our September 2023 meetup as soon as it was available.
Recently, we have also created a Discord server, a platform similar to Slack. This was suggested by one of our members, Ken Wong, and it has been a great addition to our community. We have been growing the server organically since October of last year by marketing it to attendees who visit our events, particularly on the Saturday morning meetups. This has opened up an additional space for us to collaborate and share content asynchronously. Ken has done an excellent job of organizing the server and has added some automated processes that post from R blogs, journal articles, and tweets from high-profile R users. Overall, we are pleased with our progress and look forward to continuing to improve our initiatives.
How do I Join?
R Consortium’s R User Group and Small Conference Support Program (RUGS) provides grants to help R groups organize, share information, and support each other worldwide. We have given grants over the past four years, encompassing over 68,000 members in 33 countries. We would like to include you! Cash grants and meetup.com accounts are awarded based on the intended use of the funds and the amount of money available to distribute.
Cleveland R User Group: Embracing Hybrid Models and R Analytics in Baseball
The Cleveland R User Group, co-organized by Alec Wong, has been actively navigating the shifting dynamics of community involvement during the pandemic, with regular virtual meetups and post-pandemic hybrid models. A recently spotlighted event discussed the use of R for analyzing baseball data. This article explores the key details of the event, the use of R in both academic and industrial settings within Cleveland, and how the group is heightening inclusivity and communication methods.
Use of R in Cleveland
According to Wong, the usage and interest of R in Cleveland has remained steady since 2019. While it’s particularly prevalent in academic environments, the programming language is also utilized by several companies, including Progressive Insurance where Wong works. Additionally, the Cleveland Guardians baseball team uses R for data science applications.
Local and Remote Involvement
The Cleveland R User Group regularly holds meetups in hybrid format. While some members prefer to meet in person, the majority of the meetings take place virtually. The user group is actively searching for a permanent physical meeting space. This virtual trend paved the way to host speakers and attendees from across the country, extending the reach outside of Cleveland.
Event Spotlight: Using R to Analyze Baseball Data
The group recently held an event on September 27th, 2023, titled “How Major League Teams Use R to Analyze Baseball Data,” with Keith Woolner, the principal data scientist at the Cleveland Guardians baseball team. Keith illustrated several statistical methods used in sports analytics with R, including the use of a generalized additive model to evaluate the performance of catchers’ ability.
Greater Inclusivity and Improved Communication
The Cleveland R User Group is working on enhancing inclusivity and improving communication among its members by leveraging technologies like GitHub and Discord. John Blischak, a fellow co-organizer of the team, has developed a website using GitHub Pages, and the team has been posting recordings of their meetups on YouTube to improve accessibility. Recently, a Discord server was created to provide a platform for collaboration and content sharing among community members.
Actionable Advice
Encourage Hybrid Meetups: Companies and communities alike shouldn’t hesitate to continue embracing virtual platforms for increased accessibility and wider reach even post-pandemic.
Utilize Digital Tools for Inclusivity: By leveraging digital platforms like GitHub and Discord, communities like the Cleveland R User Group can streamline communications, improve visibility, and promote inclusivity.
Apply for Grants: For similar user groups or communities, it might be worth scrambling to the relevance of R Consortium’s R User Group and Small Conference Support Program (RUGS) that offers grants to help R groups organize.
Exploit the Power of R: With versatile use cases of R in different industries, it’s an opportunity for academia and businesses to keep exploring and harnessing the power of R for both simple and complex analytical tasks.
[This article was first published on R Consortium, and kindly contributed to R-bloggers]. (You can report issue about the content on this page here)
Want to share your content on R-bloggers? click here if you have a blog, or here if you don’t.
Nadejda Sero, the founder of the R Ladies Cotonou chapter, shared with the R Consortium her experiences learning R, the challenges of running an R community in a developing country, and her plans for 2024. She also emphasized the importance of considering the realities of the local R community when organizing an R User Group (RUG).
Please share about your background and involvement with the RUGS group.
My name is Nadejda Sero, and I am a plant population and theoretical ecologist. I have a Bachelor of Science in Forestry and Natural Resources Management and a Master of Science in Biostatistics from the University of Abomey-Calavi (Benin, West Africa). I discovered R during my Master’s studies in 2015. From the first coding class, I found R exciting and fun. However, as assignments became more challenging, I grew somewhat frustrated due to my lack of prior experience with a programming language.
So, I jumped on Twitter (current X). I tweeted, “The most exciting thing I ever did is learning how to code in R!” The tweet caught the attention of members of the R Ladies global team. They asked if I was interested in spreading #rstats love with the women’s community in Benin. I was thrilled by the opportunity and thus began my journey with R-Ladies Global.
The early days were challenging due to the novelty of the experience. I did not know much about community building and social events organization. I started learning about the R-Ladies community and available resources. The most significant work was adjusting the resources/tools used by other chapters to fit my realities in Benin. My country, a small French-speaking developing African country, had poor internet access and few organizations focused on gender minorities. (We are doing slightly better now.) On top of that, I often needed to translate some materials into French for the chapter.
As I struggled to make headway, the R-Ladies team launched a mentoring program for organizers. I was fortunate enough to participate in the pilot mentorship. The program helped me understand how to identify, adjust, and use the most effective tools for R-Ladies Cotonou. I also gained confidence as an organizer and with community work. With my fantastic mentor’s help, I revived the local chapter of R-Ladies in Cotonou, Benin. I later joined her in the R-Ladies Global team to manage the mentoring program. You can read more about my mentoring experience on the R-Ladies Global blog.
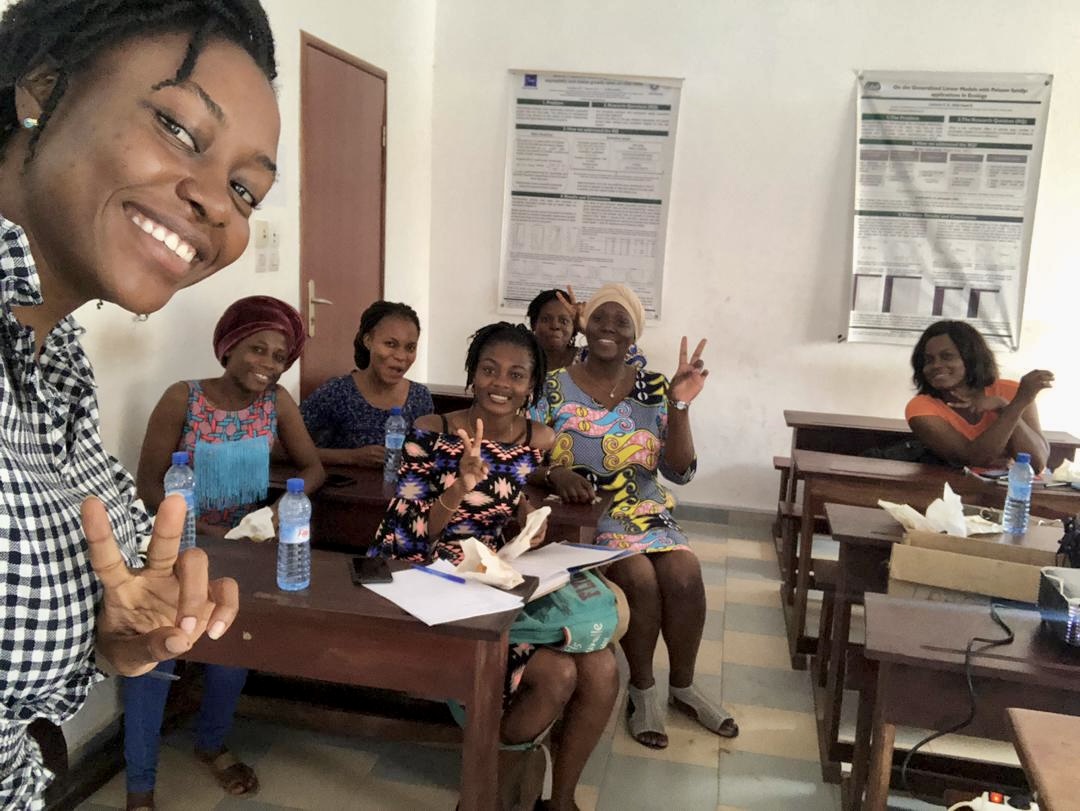
Happy members of R-Ladies Cotonou sharing some pastries after the presentation. At our first official meetup, the attendees discovered and learned everything about R-Ladies Global and R-Ladies Cotonou.
I am grateful for the opportunity to have been a part of the R-Ladies community these last six years. I also discovered other fantastic groups like AfricaR. I am particularly proud of the journey with R-Ladies Cotonou. I am also thankful to the people who support us and contribute to keeping R-Ladies Cotonou alive.
Can you share what the R community is like in Benin?
R has been commonly used in academia and more moderately in the professional world over the past 2-3 years. For example, I worked with people from different areas of science. I worked in a laboratory where people came to us needing data analysts or biostatisticians. We always used R for such tasks, and many registered in R training sessions. The participants of these sessions also came from the professional world and public health. I have been out of the country for a while now, but the R community is booming. More people are interested in learning and using R in different settings and fields. I recently heard that people are fascinated with R for machine learning and artificial intelligence. It is exciting to see that people are integrating R into various fields. There are also a few more training opportunities for R enthusiasts.
Can you tell us about your plans for the R Ladies Cotonou for the new year?
More meetups from our Beninese community, other R-Ladies chapters, and allies.
We are planning a series of meetups that feature students from the training “Science des Données au Féminin en Afrique,” a data science with R program for francophone women organized by the Benin chapter of OWSD (Organization for Women in Science for the Developing World). We have three initial speakers for the series: the student who won the excellence prize and the two grantees from R-Ladies Cotonou. The program is an online training requiring good internet, which is unfortunately expensive and unreliable. If you want good internet, you must pay the price.
R-Ladies Cotonou supported two students (from Benin and Burkina Faso) by creating a small “internet access” grant using the R Consortium grant received in 2020.
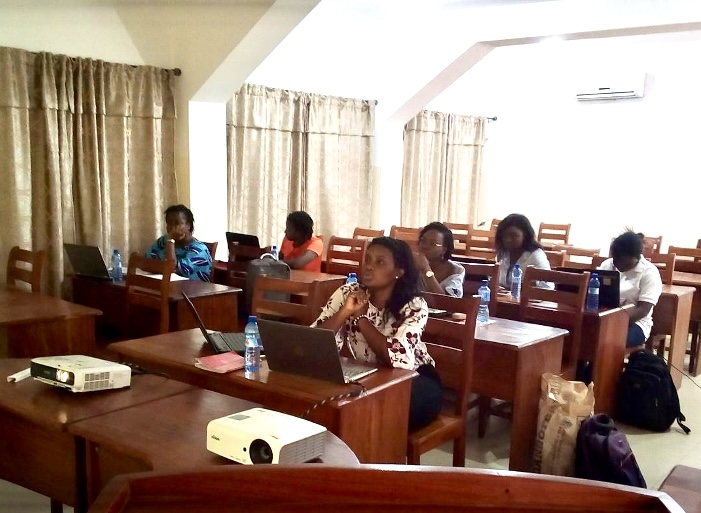
The meetup speaker is taking us through a review of the most practical methods of importing and exporting datasets in R. The attendees are listening and taking notes.
This next series of meetups will focus on R tutorials with a bonus. The speakers will additionally share their stories embracing R through the training. The first speaker, Jospine Doris Abadassi, will discuss dashboard creation with Shiny and its potential applications to public health. I hope more folks from the training join the series to share their favorite R tools.
I believe these meetups will assist in expanding not only the R-Ladies but the entire R community. I particularly enjoy it when local people share what they have learned. It further motivates the participants to be bold with R.
About “Science des Données au Féminin en Afrique“, it is the first time I know that a data science training is free for specifically African women from French-speaking areas. Initiated by Dr. Bernice Bancole and Prof. Thierry Warin, the program trains 100 African francophone women in data science using R, emphasizing projects focused on societal problem resolution. The training concluded its first batch and is now recruiting for the second round. So, the community has expanded, and a few more people are using R. I appreciate that the training focuses on helping people develop projects that address societal issues. I believe that it enriches the community.
As I said in my last interview with the R consortium, “In some parts of the world, before expecting to find R users or a vivid R community, you first need to create favorable conditions for their birth – teach people what R is and its usefulness in professional, academic, and even artistic life.” It is especially true in Benin, whose official language is French. English is at least a third language for the average multilingual Beninese. Many people are uncomfortable or restrained in using R since most R materials are in English. I hope this OWSD Benin training receives all the contributions to keep running long-term. You can reach the leading team at owsd.benin@gmail.com.
Our other plan is to collaborate with other R-Ladies chapters and RUGS who speak French. If you speak French and want to teach us something, please email cotonou@rladies.org.
Otherwise, I will be working on welcoming and assisting new organizers for our chapter. So, for anyone interested, please email cotonou@rladies.org.
Are you guys currently hosting your events online or in-person? And what are your plans for hosting events in 2024?
We used to hold in-person events when we started. Then, the COVID-19 pandemic hit, and we had to decide whether to hold events online. Organizing online events became challenging due to Cotonou’s lack of reliable internet access or expensive packages. As a result, we only held one online event with poor attendance. We took a long break from our activities.
Going forward, our events will be hybrid, a mix of in-person and online events. In-person events will allow attendees to use the existing infrastructure of computers and internet access of our allies. It also offers an opportunity to interact with participants. Therefore, I am working with people in Cotonou to identify locations with consistent internet access where attendees can go to attend the meetups. Online events will be necessary to accommodate speakers from outside of the country. It will be open to attendees unable to make it in person.
Any techniques you recommend using for planning for or during the event? (Github, zoom, other) Can these techniques be used to make your group more inclusive to people that are unable to attend physical events in the future?
The techniques and tools should depend on the realities of the community. What language is comfortable for attendees? What meeting modality, online or in person, works best for participants?
As mentioned earlier, I was inexperienced, and organizing a chapter was daunting. My mentoring experience shifted my perspective. I realized that I needed to adjust many available resources/tools. Organizing meetups became easier as I integrated all these factors.
For example, our chapter prioritizes other communication and advertisement tools like regular emails and WhatsApp. The group is mildly active on social media, where the R community is alive (X/Twitter, Mastodon). It is easier to have a WhatsApp group to share information due to its popularity within our community. We recently created an Instagram account and will get LinkedIn and Facebook pages (with more co-organizers). I would love a website to centralize everything related to R-Ladies Cotonou. Using emails is an adjustment to Meetup, which is unpopular in Benin. Getting sponsors or partners and providing a few small grants for good internet would help tremendously our future online events.
Adjusting helps us to reach people where they are. It is imperative to consider the community, its realities, and its needs. I often asked our meetup participants their expectations, “What do you anticipate from us?” “What would you like to see in the future?” Then, I take notes. Also, we have Google Forms to collect comments, suggestions, potential speakers, contributors, and preferred meeting times. It is crucial to encourage people to participate, especially gender minorities less accustomed to such gatherings.
I have also attempted to make the meetups more welcoming and friendly in recent years. I always had some food/snacks and drinks available (thanks to friends and allies). It helps make people feel at ease and focus better. I hope the tradition continues for in-person meetups. It is valuable to make the meetups welcoming and friendly. How people feel is essential. If they come and feel like it is a regular lecture or course, they may decide to skip it. But, if they come to the meetup and learn while having fun, or at the very least, enjoy it a little, it benefits everyone.
These are some of the key aspects to consider when organizing a meetup. It is critical to consider the people since you are doing it for them. Also, make sure you have support and many co-organizers if possible.
All materials live on our GitHub page for people who can’t attend physical events. Another solution would be recording and uploading the session on the R-Ladies Global YouTube or our channel.
What industry are you currently in? How do you use R in your work?
I am now a Ph.D. student in Ecology and Evolutionary Biology at the University of Tennessee in Knoxville.
R has no longer been my first programming language since I started graduate school. I still use R for data tidying data analysis but less extensively. I worked a lot with R as a master’s student and Biostatistician. It was constant learning and growth as a programmer. I had a lot of fun writing my first local package. However, I now work more with mathematical software like Maple and Mathematica. I wish R were as smooth and intuitive as this software for mathematical modeling. I like translating Maple code to R code, especially when I need to make visualizations.
I am addicted to ggplot2 for graphs. I love learning new programming languages but am really attached to R (it’s a 9-year-old relationship now). I developed many skills while programming in R. R helped me become intuitive, a fast learner, and sharp with other programming languages.
My most recent project that utilized R, from beginning to end, was a project in my current lab on the evolutionary strategies of plants in stochastic environments. We used R for demographic data tidying and wrangling. Data analysis was a mix of statistical and mathematical models. It was a good occasion to practice writing functions and use new packages. I enjoy writing functions for any task to automate repetitive tasks, which reduces the need for copying and pasting code. I also learned more subtleties in analyzing demographic data from my advisor and colleagues who have used R longer.
How do I Join?
R Consortium’s R User Group and Small Conference Support Program (RUGS) provides grants to help R groups organize, share information, and support each other worldwide. We have given grants over the past four years, encompassing over 68,000 members in 33 countries. We would like to include you! Cash grants and meetup.com accounts are awarded based on the intended use of the funds and the amount of money available to distribute.
Potential Long-term Implications and Future Developments in Data Science Community Building
In a recent interview, Nadejda Sero, the founder of the R Ladies Cotonou chapter in Benin, West Africa, shared her experiences learning the R programming language and organizing a local R User Group (RUG). As part of the broader global R community, Sero has navigated the challenges of leading data science initiatives in a developing country and has set ambitious plans for the future.
As such, her story provides critical insights into contributing factors for successful community development and offers invaluable lessons to the broader data science community.
Lessons from the R Ladies Cotonou Experience
The experiences of Sero and the R Ladies Cotonou could pave the way for future growth of data science communities, particularly in developing countries. Their strategies on overcoming language and technological obstacles have proven successful and can provide a roadmap for others facing similar challenges.
The necessity of adapting resources to local needs is paramount. Sero has emphasized how improvising with available tools and adjusting them to suit local realities can be beneficial. This mindset could encourage other organizers to think creatively about their resources.
The effort to promote diversity and inclusive participation, particularly within gender minorities, is another noteworthy effort. It demonstrates that fostering an inclusive environment is central to a thriving data science community.
Finally, ensuring events are enjoyable and not just educational can boost attendance and involvement. A positive and fun atmosphere creates a more attractive community for potential members.
Future Developments: Bringing Data Science to More Communities
With data science as an increasingly sought-after skill across various industries, communities like R Ladies Cotonou serve a critical role in advancing technology inclusion, particularly in areas with limited resources. Initiatives that focus on local languages, such as French in Benin, can increase accessibility for non-English speakers and therefore broaden the reach of data science training.
Looking ahead, remote learning initiatives will likely continue to be a crucial part of community-building in data science. Good internet access is often an ongoing challenge, so strategies for boosting online participation will play an essential role in community growth. Hybrid events that mix in-person and online learning could be a promising solution.
Taking Action: Advice Based on These Insights
Based on the insights shared by Sero, here are some actionable steps relevant to anyone interested in establishing or developing a data science community:
Adapt resources to suit local conditions: Existing resources may not fit perfectly into every setting. Be prepared to customize them to suit the unique needs of the local community.
Promote inclusiveness: Exert deliberate efforts to create an inclusive environment that encourages participation from all sections of society, particularly those underrepresented in tech.
Make it fun: Create an engaging atmosphere where members do not just learn but can also enjoy themselves.
User-friendly online infrastructure: Considering the increasing reliance on remote participation, good online infrastructure should be a priority. This includes stable internet access and user-friendly platforms for online meetings.
Encourage voluntary involvement: Foster a sense of collective ownership by encouraging members to contribute freely. This can enhance community cohesion and sustainability.
In conclusion, community building in data science requires consideration of local realities, commitment to inclusive participation, creative use of resources, and strategic use of online platforms. By harnessing these insights effectively, budding communities can thrive and contribute to the broader goal of creating a diverse, global data science network.
Learn a modern approach to stream real-time data in Jupyter Notebook. This guide covers dynamic visualizations, a Python for quant finance use case, and Bollinger Bands analysis with live data.
Examining the Art of Streamlining Real-time Data in Jupyter Notebook
Improvements in real-time data processing methodologies are changing the landscape of various industries, including finance. An innovative approach pursued in this area concerns the usage of Jupyter Notebook for dynamic visualizations, Python for quantitative finance use cases, and Bollinger Bands analysis with live data. Understanding these concepts in detail can empower businesses to make informed decisions rapidly and accurately.
Long-Term Implications and Future Developments
The use of Jupyter Notebook and Python for quantitative finance has wide-reaching implications. With increasing complexities in financial markets, businesses are recognizing the need to access real-time market data and streamline their financial analyses. The intersection of Python programming with Jupyter Notebook opens the door to perform complex mathematical computations on live datasets, bringing benefits such as real-time updates and visualizations.
Future development in this area will likely focus on integrating additional tools to streamline machine learning models or statistical analysis for more accurate financial predictions. Moreover, further advancements may allow real-time data accessibility from diverse platform sources, promoting even more comprehensive financial analysis.
Actionable Advice
Given these key points, businesses looking to enhance their financial analysis are advised to:
Invest in Python Programming: This is a powerful tool for financial modeling and machine learning applications. By mastering Python, businesses can implement these strategies more effectively.
Embrace Jupyter Notebook: This system simplifies the visualization and documentation of data, allowing for clear, easy-to-understand reports based on real-time data.
Explore Bollinger Bands Analysis: This innovative technique is well-suited for analyzing price volatility and trading patterns, presenting potentially profitable investment opportunities.
Stay Ahead with Continuous Learning: With the dynamic nature of technology and financial markets, it’s critical to stay updated with the latest trends and developments.
Conclusion
In conclusion, the use of Jupyter Notebook and Python in streamlining real-time data presents an exciting opportunity for those engaged in financial analysis. By leveraging the benefits of these tools and staying nimble in this rapidly-evolving field, businesses can gain a competitive edge in the marketplace.
arXiv:2402.07924v1 Announce Type: cross
Abstract: Mixed Reality (MR) and Artificial Intelligence (AI) are increasingly becoming integral parts of our daily lives. Their applications range in fields from healthcare to education to entertainment. MR has opened a new frontier for such fields as well as new methods of enhancing user engagement. In this paper, We propose a new system one that combines the power of Large Language Models (LLMs) and mixed reality (MR) to provide a personalized companion for educational purposes. We present an overview of its structure and components as well tests to measure its performance. We found that our system is better in generating coherent information, however it’s rather limited by the documents provided to it. This interdisciplinary approach aims to provide a better user experience and enhance user engagement. The user can interact with the system through a custom-design smart watch, smart glasses and a mobile app.
Mixed Reality and Artificial Intelligence: Enhancing User Engagement
Mixed Reality (MR) and Artificial Intelligence (AI) are increasingly becoming integral parts of our daily lives, revolutionizing fields like healthcare, education, and entertainment. The combination of these two technologies opens up new frontiers and possibilities for enhancing user engagement and providing personalized experiences.
The focus of this paper is on the development of a new system that combines the power of Large Language Models (LLMs) and mixed reality (MR) to create a personalized companion for educational purposes. This interdisciplinary approach aims to provide a better user experience by leveraging the capabilities of AI and MR technologies.
Leveraging the power of AI, the system is capable of generating coherent and contextually relevant information in response to user inputs or queries. By utilizing Large Language Models, which have been trained on vast amounts of data, the system can provide accurate and helpful information to users, enhancing their learning experience.
The integration of mixed reality into the system adds another layer of immersion and interactivity. Users can interact with the system through a variety of devices, including custom-designed smart watches, smart glasses, and a mobile app. These devices serve as the window into the mixed reality environment, allowing users to see and interact with virtual objects or information seamlessly blended with their real-world surroundings.
The potential applications of this system are vast. In the education sector, it can serve as a personalized tutor or study companion, providing tailored explanations and examples based on the individual’s learning style and progress. In healthcare, it can assist medical professionals during procedures by overlaying real-time information or simulations onto the patient’s body. In entertainment, it can offer immersive experiences and interactive storytelling.
As mentioned in the paper, one limitation of the system is its reliance on the documents provided to it. The quality and diversity of the documents can impact the system’s ability to generate accurate and comprehensive responses. To improve this aspect, future developments could focus on expanding the dataset and refining the pre-training process to increase the system’s knowledge base.
The wider field of multimedia information systems encompasses various technologies and techniques, including animations, artificial reality, augmented reality, and virtual realities. This paper contributes to the advancement of this field by combining AI and MR to create a personalized educational companion. The integration of animations and visualizations within the mixed reality environment can further enhance the learning experience, making complex concepts more understandable and engaging.
In conclusion, the combination of Mixed Reality and Artificial Intelligence holds great potential for enhancing user engagement and providing personalized experiences in various domains. This interdisciplinary approach brings together the fields of multimedia information systems, animations, artificial reality, augmented reality, and virtual realities, paving the way for exciting developments and innovations in the future.